Robot Arm
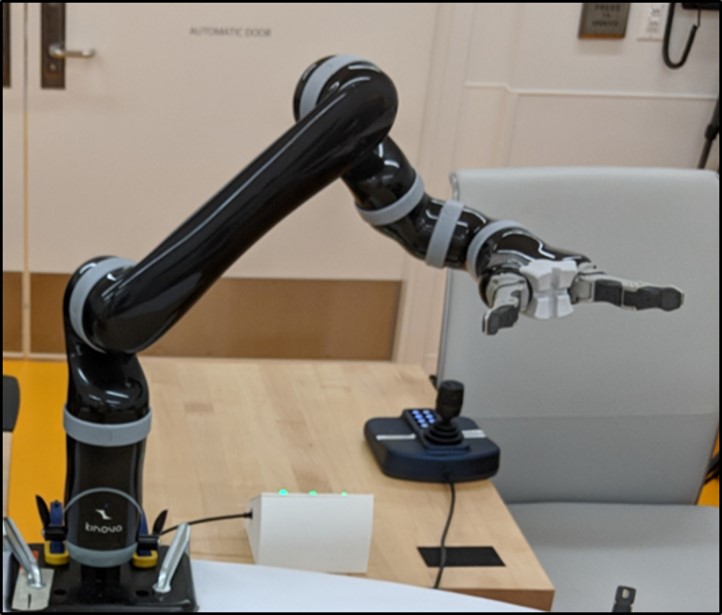
Users controlled a Kinova Mico robotic arm for a study investigating which kinematic features of a task contribute to task difficulty. The paper presenting this work is in-review.
EECS349: Intro to Machine Learning Northwestern University - Spring 2018
Can we classify a task's difficulty based on how often a user commands the robot?
Robots have the potential to improve the lives of thousands living with disabilities worldwide. A paradigm in assistive robotics is to share control of the robot in the human-robot team. The goal of this project was to investigate if machine learning methods can classify a task's difficulty by reading how frequently a user is providing joystick inputs to control a robotic arm. This is a feasability project to test if, whcn classifying tassk difficulty, user input frequency is a metric worth investigating further either as a standalone metric or as part of a larger set of metrics.
Data was collected from 20 healthy subjects. Each subject completed 26 different manipulation tasks. After finishing a task, the user would complete the NASA Task-Load Index (TLX) survey, a survey known to classify task difficulty. This created a dataset of 520 labeled, timeseries samples of user input frequency for controlling a robotic arm.
Users controlled a Kinova Mico robotic arm for a study investigating which kinematic features of a task contribute to task difficulty. The paper presenting this work is in-review.
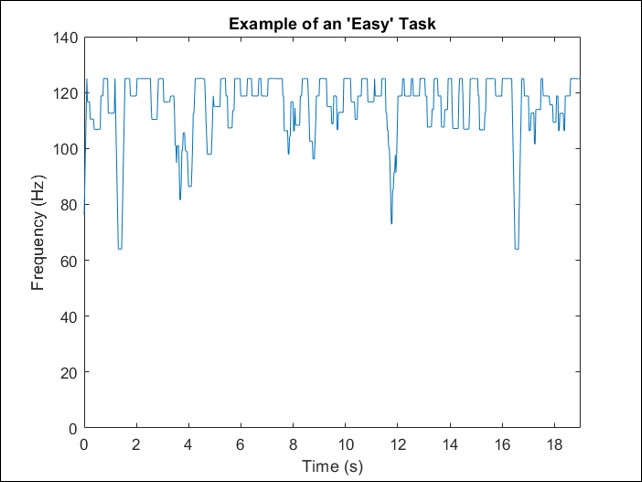
Based upon the work of a colleague, the user input frequency data was passed through either one or two 10-point moving average filters.
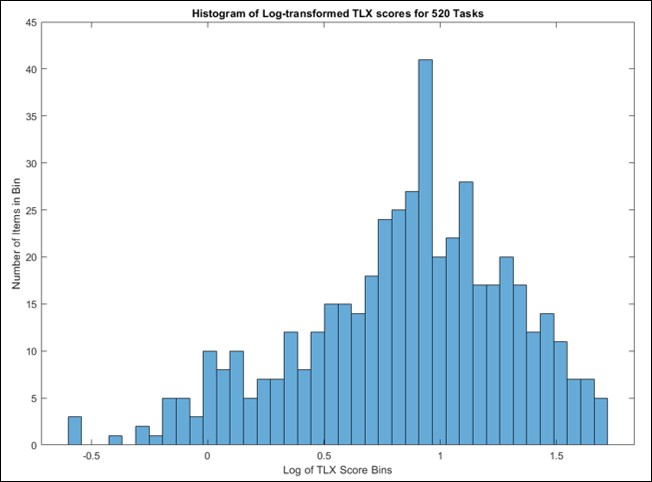
NASA-TLX data was log-transformed and then divided into easy or hard split at the 50th percentile or at the top 38 hardest tasks (informed by the kinematic feature paper). Easy-medium-hard was classified by splitting the data at the 33rd and 67th percentiles.
For method one, stasticial and user-generated features were generated based on the once-filtered joystick frequency dataset. These features are:
| Metric | Description |
|---|---|
| Standard Deviation | Standard deviation of the trial |
| Mean | Average frequency of the trial |
| Median | Middle frequency of the trial |
| Number of Outlier Features | Number of points less than 10% the mean frequency |
| Standard Deviation of Outliers | Average frequency of the outliers |
| Mean of Outliers | Average frequency of the outliers |
| Median of Outliers | Middle frequency of the outliers |
| 25th percentile of Outliers | Value representing the 25th percentile of the outliers |
| 50th percentile of Outliers | Value representing the 50th percentile of the outliers |
| 75th percentile of Outliers | Value representing the 75th percentile of the outliers |
| Most Extreme Outlier | Most extreme value in the set of outliers |
| *Length of Dataset | Length of the trial |
*This feature is strongly correlated with task difficulty, however, length of task is only known at the completion of a task. Results with and without this metric will be presented to inform online methods.
Models were trained using Weka using 10-fold cross-validation. The training methods investigated were:
For method two, recurrent neural networks (RNN), specifically long-short term memory units (LSTMs) were investigated. Since this is a proof of concept, only the number of memory units was varied. The LSTMs were trained on both the once- and twice-filtered data. Keras and TensorFlow were used for model generation. The dataset was split 90/10 for training/testing, respectively.
The best classifiers, logistic regression and a Neural Network with 50 hidden layers, were able to beat the baseline (ZeroR) by 20%. Useful classification was not derived from the Top38 label set, so, it will not be discussed. The most important feature for classification was the length of the dataset. In other words, the longer a person required to complete a task, the greater its difficulty. However, since task length isn't known until task completion, the models were retrained without this feature. The same classifiers were the best performers, however, they only beat the baseline by 10%. The most important features after duration were the number of outliers and the features describing outliers. While peak accuracy compared to ZeroR on the best models fell to 10%, this still indicates that the derived features of user input frequency may be helpful in difficulty classification. Classification performance may increase with a larger dataset. Click the images to enlarge. An appendix of raw data and more plots can be found here.
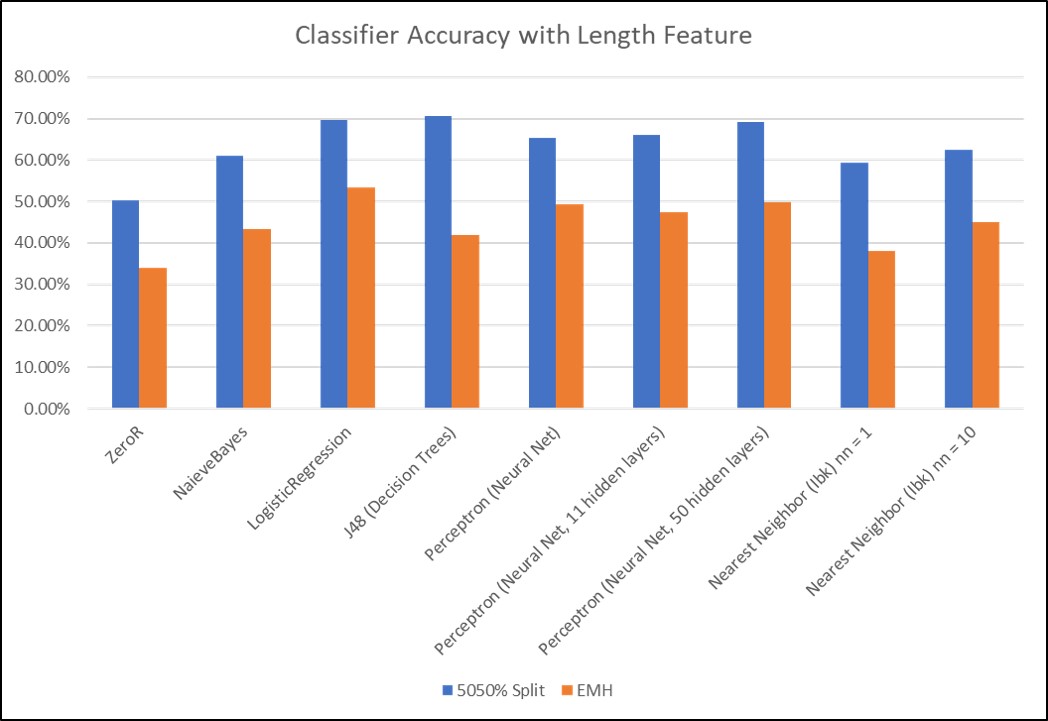
Classification accuracies for both the easy or hard and easy-medium-hard label sets using different classifers for model generation.
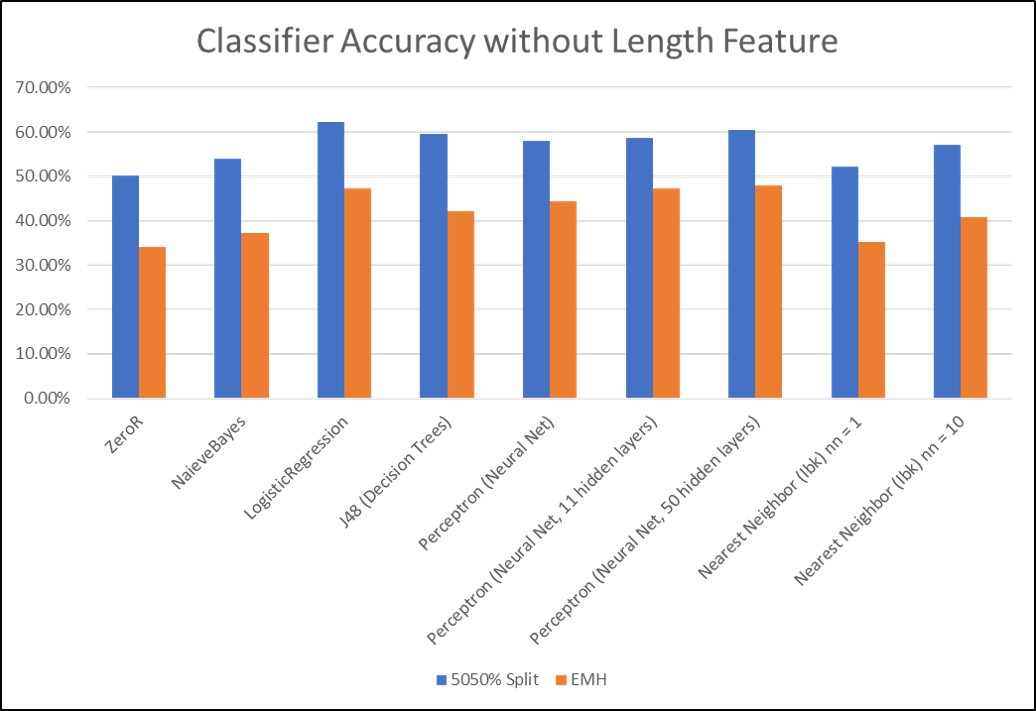
Classification accuracies for both the easy or hard and easy-medium-hard label sets using different classifers for model generation, but neglecting the task length feature.
LSTM networks consisting of 10, 50, 100, and 200 LSTM memory units were trained on both the easy-hard and the easy-medium-hard labelsets for both the once- and twice-filtered datasets. The peak accuracy for the easy-hard label set was ~63% and occured using the twice-filtered dataset with 50-100 memory units. This indicates that proper smoothing may help to accentuate key features. The peak accuracy for the easy-medium-hard labelset did not exceed 36%; since this barely exceeds the baseline classifier, it can be concluded that the LSTM network was unable to classify the easy-medium-hard label set. Similarly, the Top38 label set didn't yield meaningful results. Classification performance may increase with a larger dataset and more advanced smoothing methods such as the exponential moving average. Click the images to enlarge. An appendix of raw data and more plots can be found here.
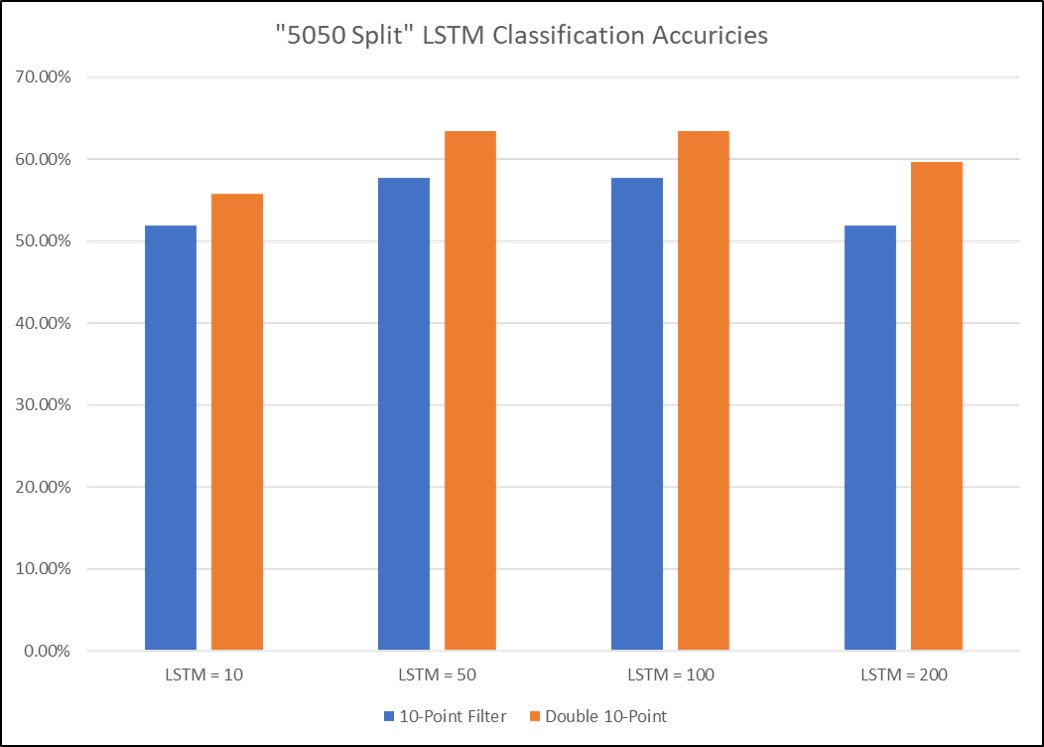
LSTM model classification performance for the easy-hard label set on both the once- and twice-filtered datasets for 10, 50, 100, and 200 LSTM memory units.
For method one, using both statistical and user-generated features, the highest classification accuracy discovered was just above 60% using either logistic regression or a neural network when not considering the length of the data set
For method two, the best performance observed using an LSTM occurred when using the twice-filtered data and 50 to 100 LSTM units. The performance was just above 60%, similar to the performance observed in method one. More advanced smoothing/filtering methods may improve classification accuracy.
Both methods lead to the following conclusions:
This project will inform the design of a study that will review user input frequency as one of many metrics for eventual online, dynamic task difficulty classification and subsequent autonomy allocation. Such a study will consist of more tasks that are extremely different in difficulty levels; the details of the design remain an area of active research for the author for the author’s PhD.
Chris Miller is a PhD student in Mechanical Engineering at Northwestern University. He's a member of the argallab, a research group at the ShirleyRyan AbilityLab and an assistive robotics researcher. For more about Chris, visit his website.